Dashboard
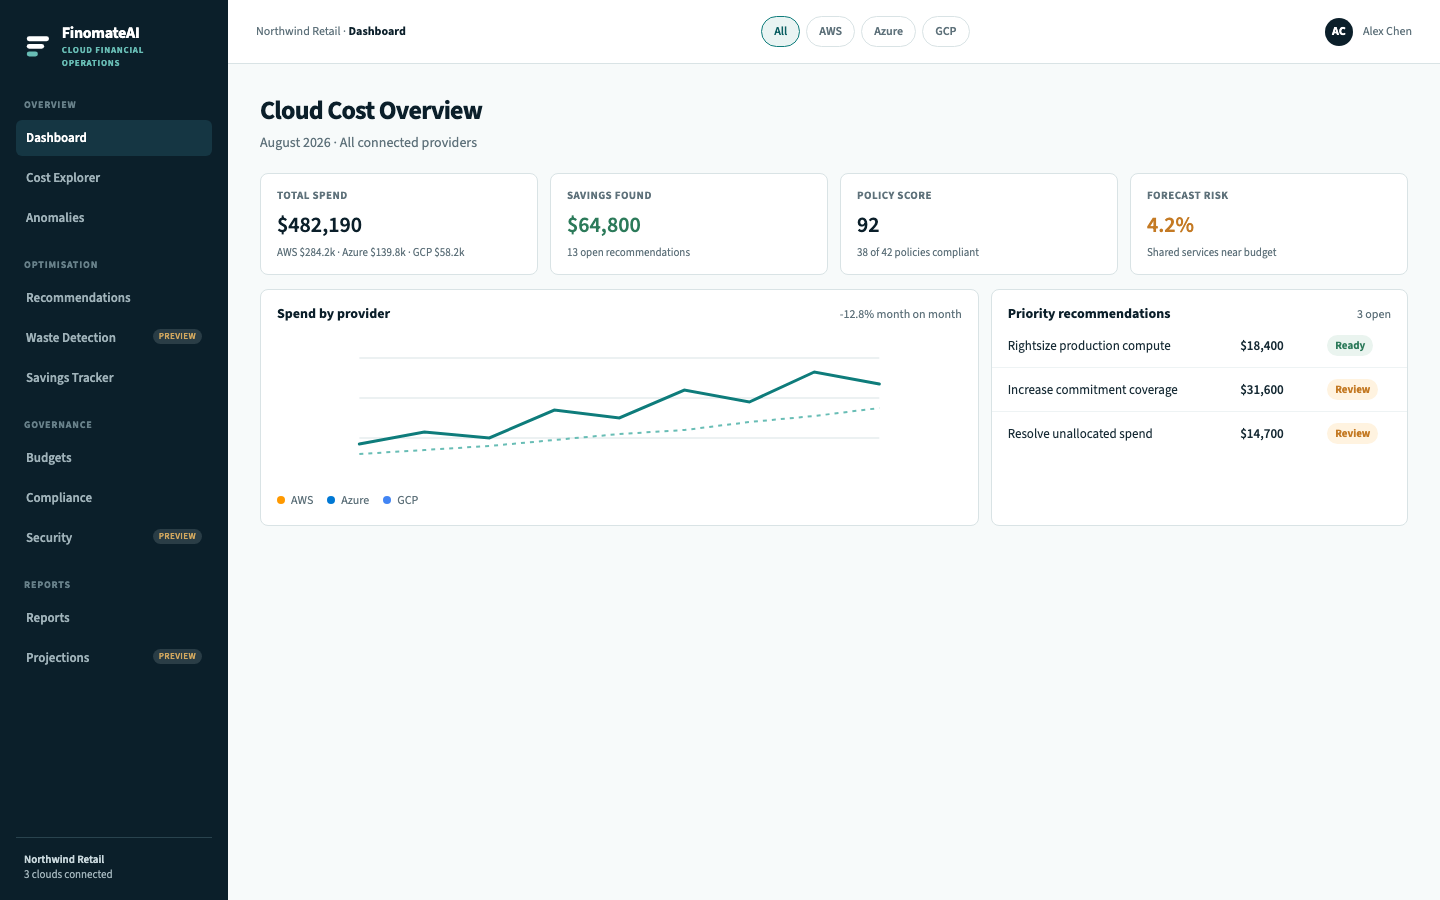
The Dashboard is the organisation-level view of spend, savings, anomalies and governance posture. Use it to decide where to look next — not as the deliverable.
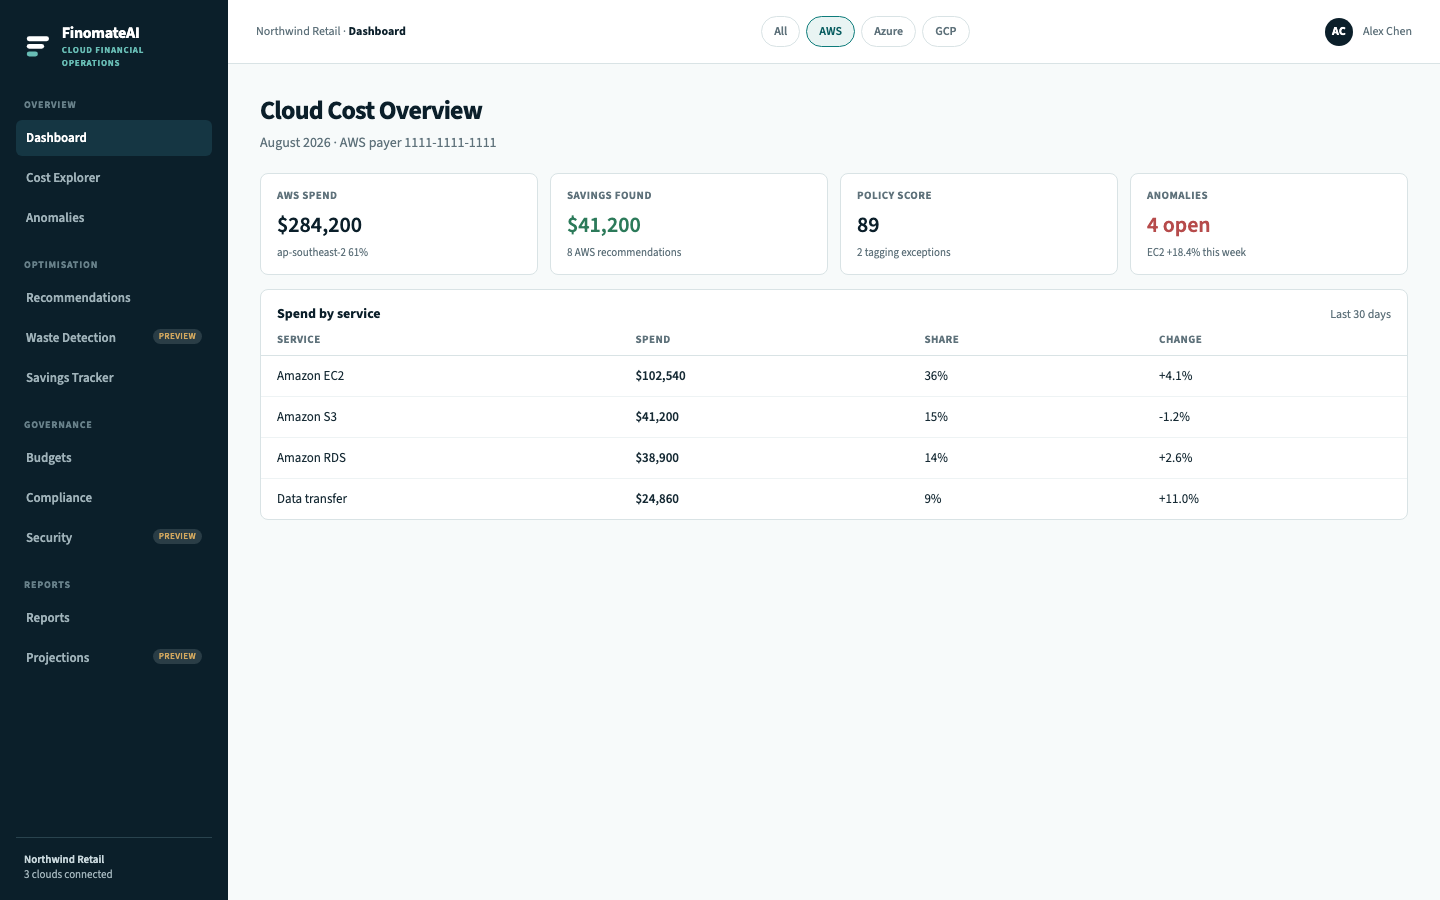
CloudHealth publishes separate AWS, Azure and GCP dashboards. FinomateAI uses one Dashboard and the provider chip (All, AWS, Azure, GCP) so a multi-cloud review does not start on three pages.
Sample organisation
Screenshots use the Northwind Retail sample estate (AWS, Azure and GCP for August 2026). Your totals, owners and resource identifiers will differ.
Before you begin
- Confirm the organisation name in the top bar.
- Confirm which clouds should be connected.
- Use a completed billing period when you are validating totals for the first time.
Set the scope
- Open Dashboard.
- Select All, AWS, Azure or GCP.
- Confirm the subtitle still describes the period you intend to review.
Read the summary
| Metric | Meaning | Do not treat it as |
|---|---|---|
| Total spend | Spend in the current monthly view | A signed-off invoice until you reconcile |
| Savings found | Estimated monthly value of current recommendations | Realised savings |
| Policy score | Share of evaluated policies that currently pass | A security certification |
| Forecast risk | Budget pressure on the current run-rate | A guarantee of month-end spend |
| Anomalies | Unusual movements in the recent window | Confirmed incidents |
Open Savings Tracker for confirmed savings. Open Anomalies before you assign a spike.
Follow the cost signal
- Review Spend by provider (or Spend by service on a single cloud).
- Open Cost Explorer for account, region and date-range detail.
- Check Priority recommendations when the opportunity is optimisation.
- Check Anomalies when the movement is unexpected.
Use the Dashboard in a review
For a recurring FinOps meeting, capture: active scope, material changes, open high-severity items, expected owner, next review date.
Expected result
You can explain the current scope, the largest cost movement, and the next detailed view required.
Common issues
| Issue | Check |
|---|---|
| A provider shows no data | Connection status, first import, provider chip |
| Total differs from billing | Account scope, dates, currency, credits — see reconciliation |
| A score looks unexpected | Open Compliance or the related detail page |