Azure Dashboard
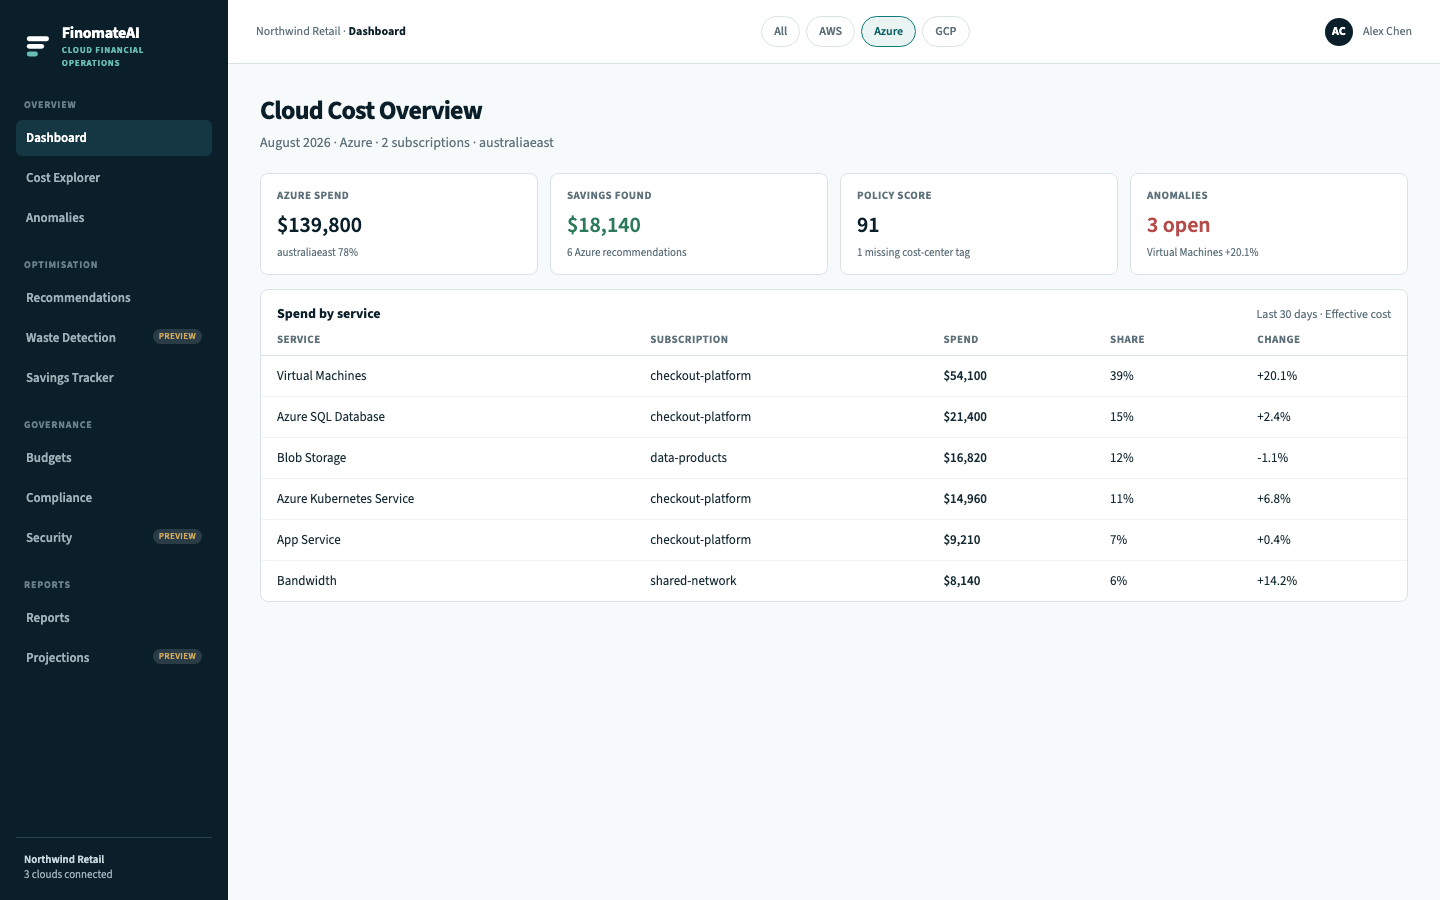
The Dashboard is the start of an Azure FinOps review. Filter it to Azure so Virtual Machines, SQL, Blob Storage and AKS are not mixed with AWS or GCP.
Before you begin
- The Azure connector is Healthy. See Connect Azure.
- You know which subscriptions should appear (
checkout-platformanddata-productsin the sample).
Set the Azure scope
- Open Dashboard.
- Select the Azure chip. Confirm the subtitle shows Azure and the month you intend to review.
- Check Azure spend is non-zero and in the same order of magnitude as Azure Cost Analysis for that month.
If spend is $0, stop. The export has not landed or the subscription list on the connector is wrong.
Read the Azure summary
| Metric | Azure meaning | Do not treat it as |
|---|---|---|
| Azure spend | Actual (or effective) cost for in-scope subscriptions | A signed invoice until you reconcile |
| Savings found | Open Azure recommendations (rightsizing, reservations, idle disks) | Realised savings |
| Policy score | Tagging, disk and NSG checks FinomateAI evaluates | Microsoft Defender Secure Score |
| Anomalies | Unusual Azure service movements | Confirmed incidents |
Follow the cost signal
- Read Spend by service. In a typical app estate, Virtual Machines or AKS lead.
- If VMs dominate, open Azure Cost Explorer grouped by resource group, then Azure rightsizing.
- If the movement is unexpected, open Azure anomalies before you assign a resize.
- Compare Forecast risk with Azure budgets.
Reconcile against Azure Cost Analysis
For the first month:
- In Azure Portal, open Cost Management → Cost analysis.
- Scope = the same subscriptions.
- Granularity = monthly, actual cost, same currency.
- Variance under ~2% after credits and Azure Hybrid Benefit is expected. Larger gaps: see Reconciliation.
Expected result
You can name Azure monthly spend, the leading service, and the next page (Explorer, anomalies or recommendations).