Azure Cost Explorer
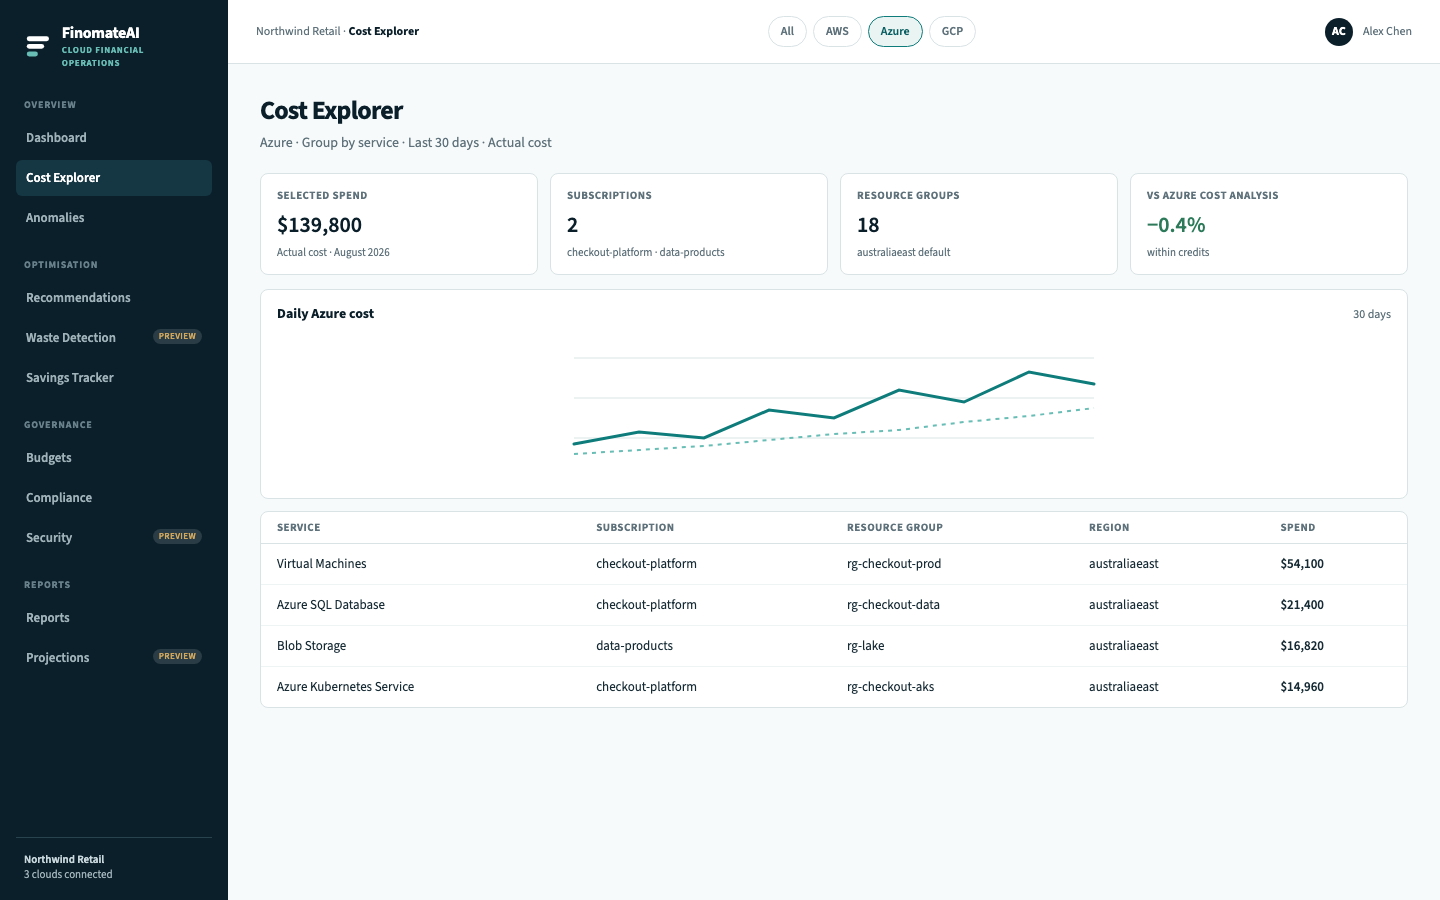
Cost Explorer is where you explain an Azure Dashboard total. Filter to Azure, pick actual or amortised cost, and group by the dimension finance will argue about.
Before you begin
- Azure connector is healthy and a completed month has imported.
- You have Azure Cost Analysis open for the same subscriptions.
Open a useful Azure view
- Open Cost Explorer.
- Select Azure.
- Set the range to a completed month the first time (not MTD).
- Set cost type to Actual to match Cost Analysis actual cost. Use Amortised when you are comparing reservation benefit.
- Group by Service.
- Confirm Selected spend matches the Dashboard Azure total for that range.
Azure dimensions
| Column | Azure meaning |
|---|---|
| Service | Meter category (Virtual Machines, Azure SQL Database, Blob Storage, Bandwidth) |
| Subscription | Billing scope you listed at connect time |
| Resource group | rg-* container in the subscription |
| Region | australiaeast, australiasoutheast, and so on |
| Spend | Amount for the selected cost type |
Resource-level rows (VM name, disk, SQL server) appear after you drill down.
Typical Azure questions
| Question | How to answer it |
|---|---|
| Why is checkout-platform over budget? | Filter subscription = checkout-platform; group by resource group |
| Is australiaeast concentration a problem? | Group by region |
| Did reservations change the VM bill? | Switch Actual vs Amortised; open Azure reservations |
| Who owns Blob Storage growth? | Filter service = Blob Storage; group by resource group, then tags |
Match Azure Cost Analysis
| FinomateAI | Azure Cost Analysis |
|---|---|
| Actual cost | Actual cost |
| Amortised cost | Amortized cost |
| Service | Service name |
| Subscription | Subscription |
| Resource group | Resource group |
If FinomateAI is higher: export includes a subscription Cost Analysis does not. If lower: missing subscription on the connector, or the export has not caught up.
Expected result
You can name the services, subscriptions and resource groups that explain the Azure Dashboard total, and the variance to Cost Analysis is understood.