Azure anomalies
Anomalies on the Azure chip are cost movements that differ from a 30-day baseline (two standard deviations). They are signals. Confirm subscription, resource group and meter before you assign a resize or a ticket.
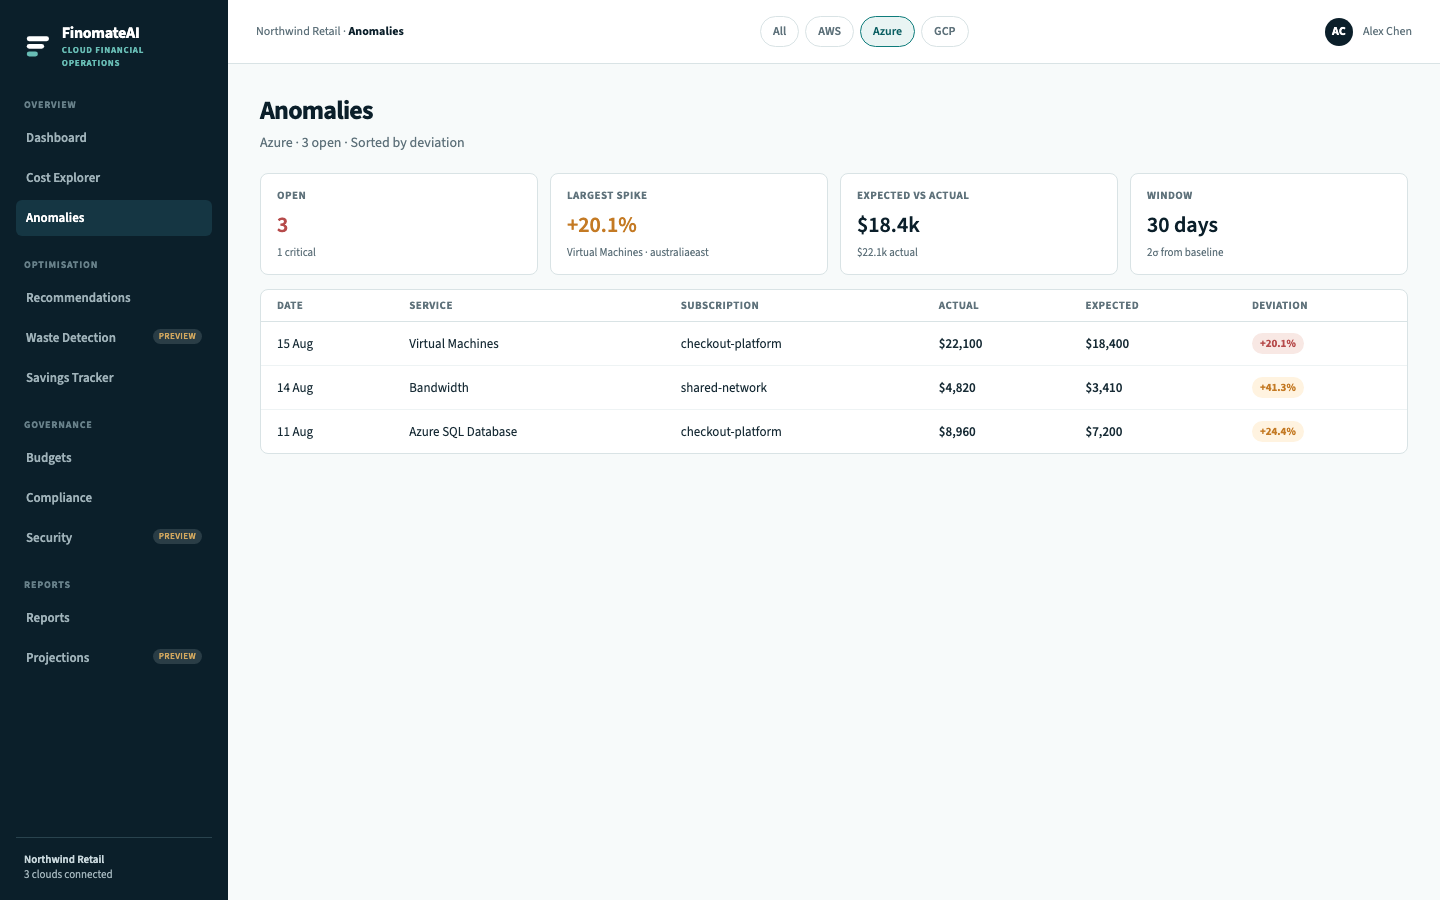
Open Azure anomalies
- Open Anomalies.
- Select Azure.
- Sort by deviation.
- Open the largest row.
What a typical Azure spike looks like
| Service | Often means | Next check |
|---|---|---|
| Virtual Machines | Scale-out, forgotten staging, SKU upgrade | Resource group, VM list, activity log |
| Bandwidth | Egress to internet or paired region | NSG, CDN, backup jobs |
| Azure SQL Database | DTU/vCore change, geo-replication | Service tier, backup retention |
| AKS | Node pool scale | Cluster autoscaler, failed drain |
| Blob Storage | Lifecycle policy off, dump load | Container growth, replication |
Investigate
- Note actual, expected, subscription and date.
- In Cost Explorer, filter to that service and day.
- Drill to resource group, then resource.
- In Azure Portal, open Activity log on that resource group for the same window.
- Assign an owner from tags (
owner,product) or the subscription default.
Do not accept a rightsizing recommendation on the same resources until you know the spike was not a legitimate scale event.
Expected result
The largest Azure anomaly has a cause, an owner and a next action (leave it, raise a ticket, or open a recommendation).