Anomalies
Anomalies are cost movements that differ from a 30-day baseline (two standard deviations in the current product). They are signals. Confirm contributing dimensions before you assign work.
CloudHealth’s Anomaly Dashboard is the same job: list unusual cost, show impact, then investigate. FinomateAI does not auto-remediate a spike.
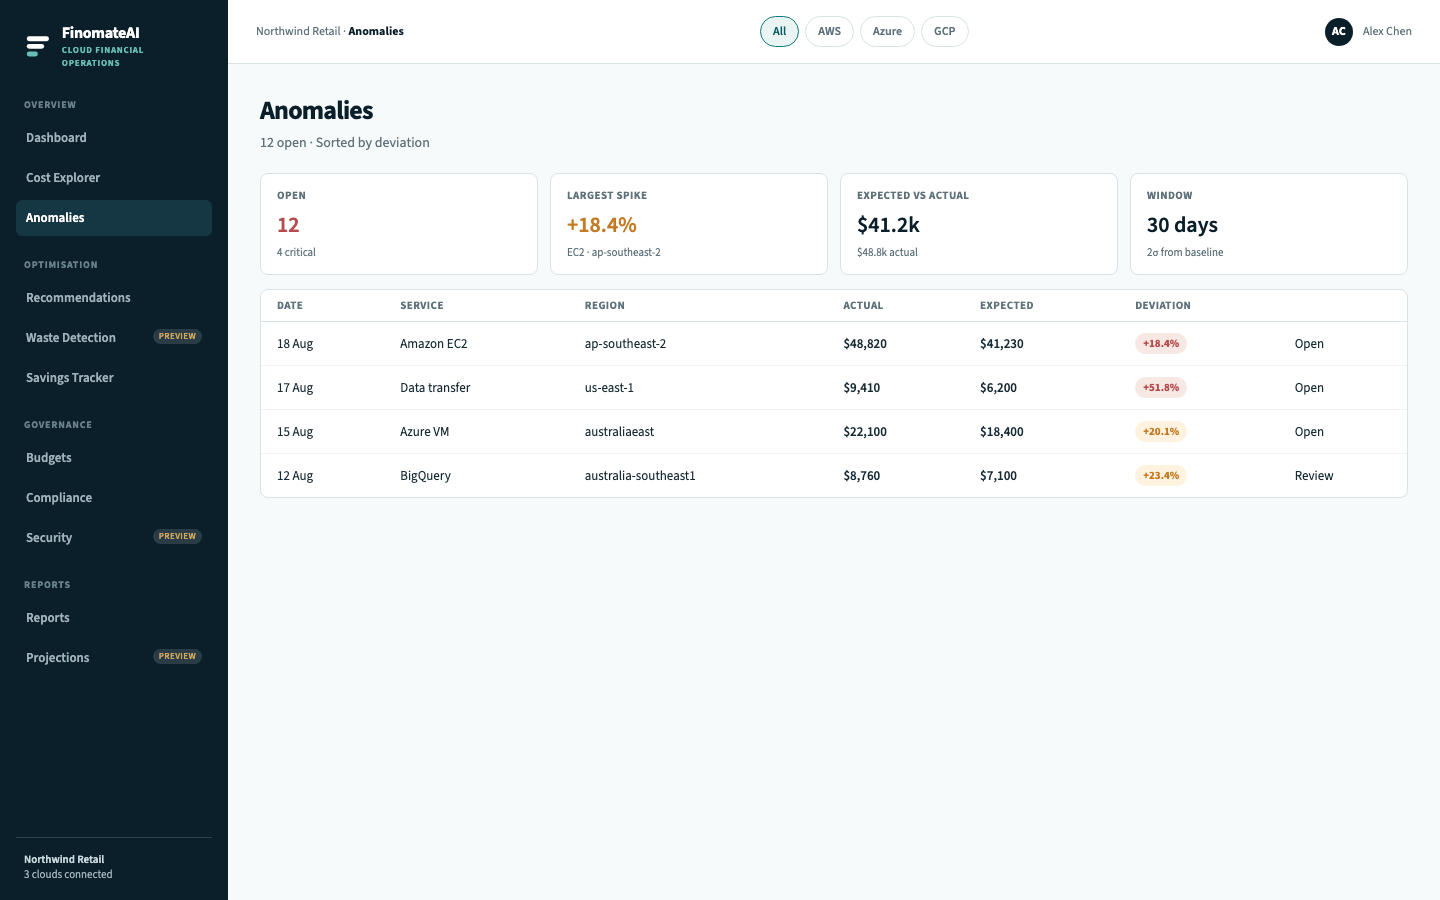
Open the list
- Open Anomalies.
- Confirm the provider chip.
- Filter by service, region or severity if the list is long.
- Sort by deviation for the first pass.
Severity
| Label | Typical deviation |
|---|---|
| Critical | Absolute change above 100% |
| High | Above 50% |
| Medium | Above 25% |
| Low | Below 25% |
What each row contains
Service, region, actual spend, expected spend, deviation, date and status (Open or Review).
Next step
Open Investigate a cost spike on the largest item. Email alerts when a spike opens are (/docs/anomalies/alerts).